This is the part where my brain is going to explode. I might need to break this up into more than one post.
RESULTS
Preparation of HMECsA single HMEC in its log phase was plated, and expanded to 1.4 × 10⁶ to 1.5 × 10⁶ cells (Fig.1). Plating efficiency during the two transfers of plates was 67 ± 0.9(mean ± SE)%. Based on these values, the number of cells that should have been produced at the time of harvest was calculated as 3.2 × 10⁶(1.4 × 10⁶/0.67/0.67). This value predicted that each cell harvested underwent 21.6 generations from the initial single cell. Doubling time was 48 h.
Strategy of cell culture. A single HMEC was inoculated in a well by limiting dilution, and the cell was expanded up to approximately 106 cells. Based on the plating efficiencies during the two transfers and the actual final cell count, the number of cells that should have been produced at the time of harvest and the number of generations observed were calculated. DNA was extracted from the final cells, and used for bisulfite sequencing. Six independent cultures were performed.
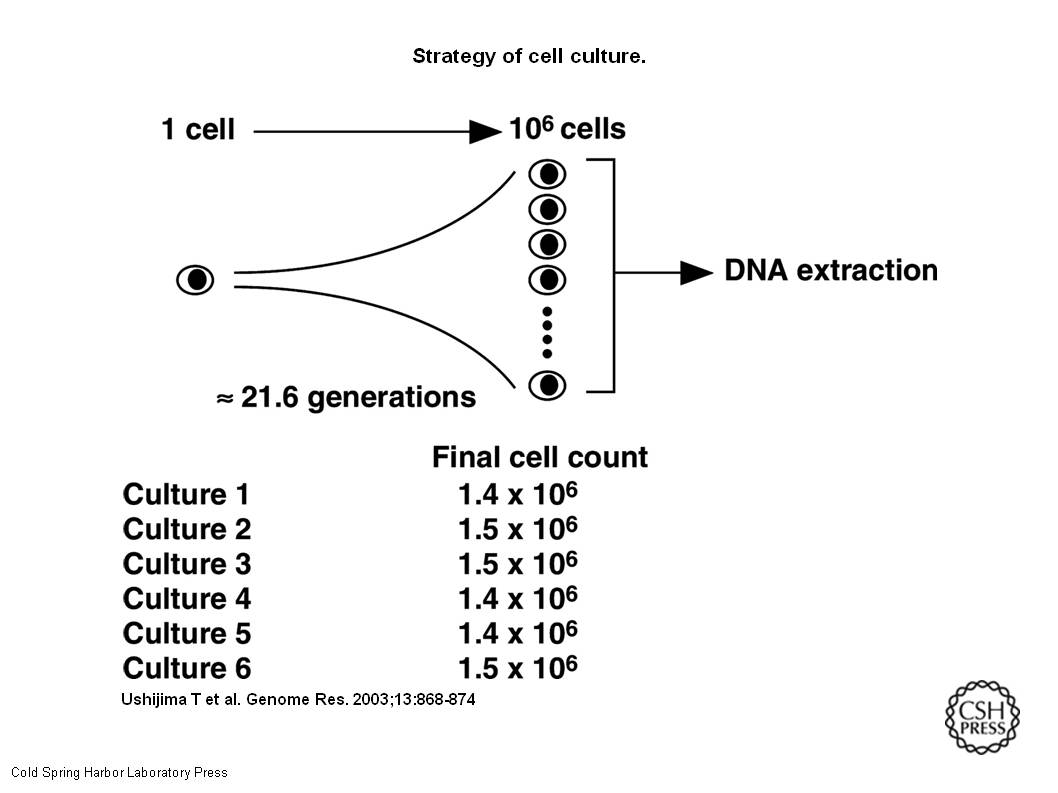
HMEC – Human Mammary Epithelial Cells. They were put into a container, allowed to reproduce, and then they were checked to see if the right number of cells were made after specific numbers of generations. There were six containers of these cells. Once enough generations had passed and there were enough cells, their DNA was tested with the bisulfate test (illustrated in my earlier post.)
Gene Selection and Their Expression Levels
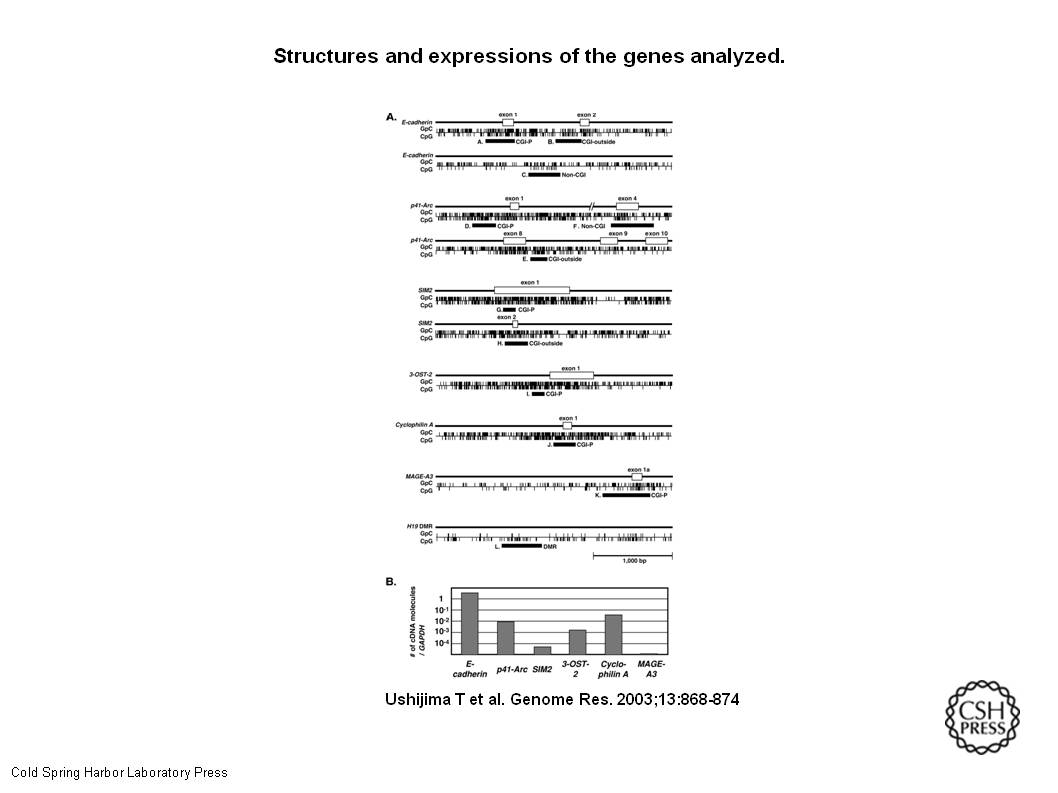
Methylation statuses were determined by bisulfite sequencing for CGIs in the promoter regions of the E-cadherin,p41-Arc, SIM2, 3-OST-2, and Cyclophilin A genes; CGIs in the downstream exon/introns of theE-cadherin, p41-Arc, and SIM2 genes; CpG sites outside CGIs of the E-cadherin and p41-Arcgenes; a NM-CGI of the MAGE-A3 gene; and differentially methylated region (DMR) of the H19 gene (Fig.2A). The former five genes were selected because they had CGIs in the downstream exon/introns that met a strict criterion of CGIs, regions of DNA of >500 bp with a G+C ⋝ 55%, and observed CpG/expected CpG of 0.65 (Takai and Jones 2002). The MAGE-A3 gene and the DMR of the H19 gene were selected as a representative NM-CGI and a region critically involved in genomic imprinting, respectively. By quantitative RT-PCR analysis, their expression levels were shown to range from almost none (SIM2 and MAGE-A3) to very high (E-cadherin), with p41-Arc, 3-OST-2 andCyclophilin A being intermediate (Fig. 2B).
Structures and expressions of the genes analyzed. (A) Schematic representation of the genomic regions analyzed. Regions analyzed by bisulfite sequencing are shown by closed boxes, and designations A–L correspond to panels in Fig. 3. CGI-P: a CGI in the promoter regions; CGI-outside: a CGI outside the promoter regions; Non-CGI: CpG sites outside CGIs; and DMR: differentially methylated region. All panels are drawn to the same scale. (B) Expression levels of the seven genes in HMECs.
Sorry, I can’t even. All I know from this is that they looked at the results of the bisulfite sequencing and found what they were looking for – the methylation status in the CpG Islands from promoter regions of DNA stayed almost exactly the same. Unmethylated CGIs from non-promoter regions were more likely to become methylated. I’m afraid I don’t have the ability to explain this to you or tell how accurate or flawed it may be. I’m taking the researchers’ word on it. Correct me if I’m wrong.
Establishment of How to Measure MPERs
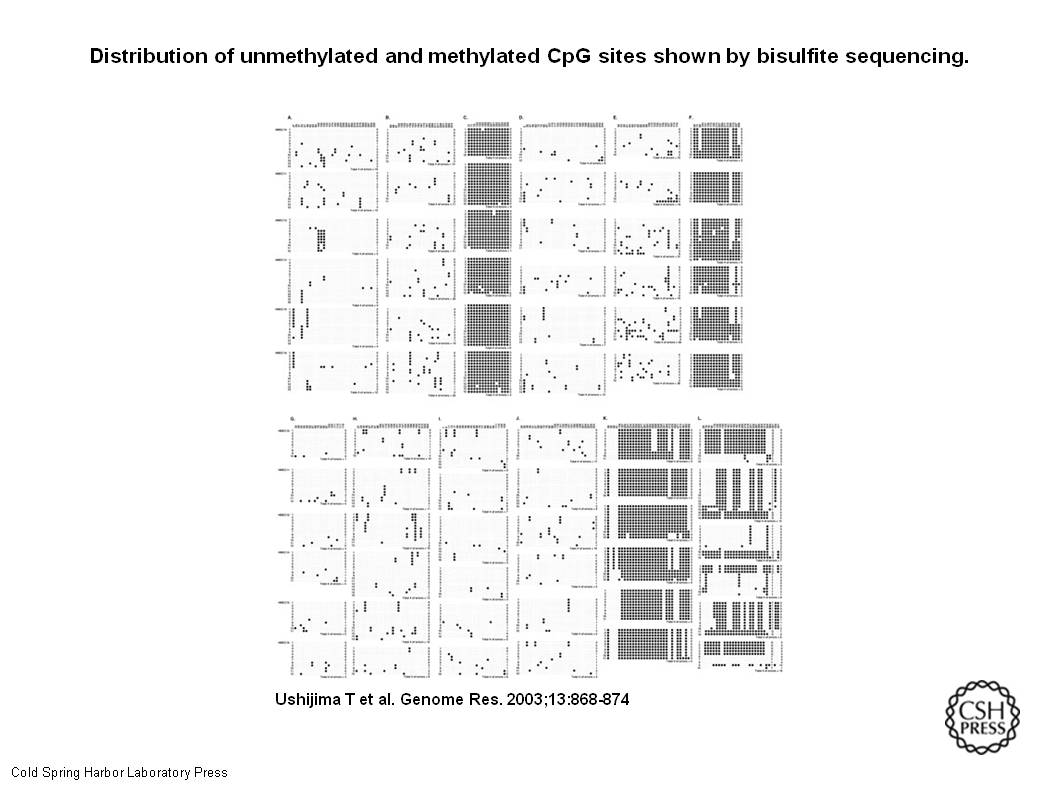
The CGI in the promoter region of the E-cadherin gene (Fig.3A), the non-CGI region of thep41-Arc gene (Fig. 3F), the CGI in the promoter region of theMAGE-A3 gene (Fig. 3K), and the DMR of the H19 gene (Fig. 3L) were found to contain two major populations of clones. The two major populations were considered to represent the methylation pattern of the two alleles in the original single cell. The methylation patterns of the two major populations were different from each other in the six cultures, which indicated that the HMECs before cloning had diverse patterns of methylation, but the patterns were relatively conserved during the culture from a single cell to approximately 106 cells. Therefore, we measured the number of errors in the methylation pattern based upon the culture from a single cell to approximately 106 cells. An MPER of a region in a culture was calculated from the number of errors in methylation pattern as described in Methods, and an average MPER of the region was calculated from the six MPERs obtained for the six cultures.
MPERS – Mammalian Protein Extraction Reagent
Allele – An allele is one of two or more versions of a gene. An individual inherits two alleles for each gene, one from each parent. If the two alleles are the same, the individual is homozygous for that gene. If the alleles are different, the individual is heterozygous. Though the term “allele” was originally used to describe variation among genes, it now also refers to variation among non-coding DNA sequences.
So after making all those cells, they looked to see where and whether methylation status had changed.
Distribution of unmethylated and methylated CpG sites shown by bisulfite sequencing. Unmethylated and methylated CpG sites are shown by open and closed circles, respectively. (A)–(C) A CGI in the promoter region, a CGI outside the promoter region and CpG sites in non-CGIs of the E-cadherin gene. (D)-(F) A CGI in the promoter region, a CGI outside the promoter region and CpG sites in non-CGIs of the p41-Arcgene. (G), (H) A CGI in the promoter region and a CGI outside the promoter region of the SIM2 gene. (I) A CGI in the promoter region of the 3-OST-2 gene. (J) A CGI in the promoter region of the Cyclophilin A gene. (K) A CGI in the promoter region of the MAGE-A3 gene, which is normally methylated. (L) A CGI in the differentially methylated region of the H19 gene.
Here’s where they found the differences:
To examine the effect of an arbitrary selection of the “original methylation pattern” in ambiguous cases, a permutation test was performed for the CGI in the E-cadherin promoter region of HMEC10. One of the clones #5–#14 (Fig. 3A) was hypothesized as one of the original methylation pattern, and the number of errors in the methylation pattern was calculated. The numbers ranged from 18–22, and these values were expected to result in the average MPER ranging from 0.022–0.023. Similar permutation tests were performed for the CGI in exon 2 of the E-cadherin gene of HMEC12 and HMEC15. The numbers of errors in methylation pattern ranged from 13–16 for HMEC12 and from 12–15 for HMEC15, and these values were expected to result in the average MPER ranging from 0.050–0.058. These showed that arbitrary selection of the original methylation pattern in ambiguous cases does not seriously affect the resultant average MPER.
Some changes weren’t so cut and dried, so they checked those cases and found that they weren’t significant enough to change the findings.
The efficiency of bisulfite conversion was examined by analyzing DNA with no methylation in the CGIs in the promoter region and exon 2 of the E-cadherin gene. In the CGI in the promoter region, none of the 600 cytosines at CpG sites (30 CpG sites per clone, 20 clones analyzed) remained unconverted, showing that unconversion rate was almost 0 in this region under our experimental condition. In the CGI in exon 2, one of 483 cytosines at CpG sites (23 CpG sites per clone, 21 clones analyzed) remained unconverted, showing that the unconversion rate was 0.0021. These values showed that the MPERs in CGIs in the promoter regions are 10-fold more than the unconversion rates.
The bisulfate conversion was also tested separately for control to make sure the results would be valid in the experiment. This reinforced the finding that the promoter regions stayed stable.
MPERs and Fidelities of Methylation Pattern in the Genome
The average MPERs obtained for each region are summarized in Table1. Unmethylated CGIs in the promoter regions showed MPERs between 0.018 and 0.032 errors/site/21.6 generations. In contrast, CGIs outside promoter regions showed significantly higher MPERs, ranging from 0.037 to 0.091 (P < 0.01 or 0.005). MPERs in the CGIs outside the promoter regions were more than twice as high as those in the promoter regions of the same genes. MPERs in Various Genomic Regions
NM-CGI of the MAGE-A3 gene and methylated alleles of the DMR of the H19 gene showed MPERs of 0.002 and 0.007, respectively. Any genomic regions that were normally methylated, whether or not they were in CGIs, showed significantly lower MPERs than those unmethylated. This was particularly clear when the MPER of the allele methylated at DMR of the H19 gene was compared with that of the other unmethylated allele.
Interpretation of the tables, summary of findings.
This is not as good as part one, sorry. In other news, I couldn’t watch Besharam because it sucked, so I didn’t learn any Hindi, either. One more post to go in this series. Anyone who can clarify/explain better than I can, please comment – I’d appreciate it.