Tag Archives: Science

All science-related posts

Learning From Research – The Discussion

Learning From Research – The Discussion

It’s been a while, and I’ve had a lot of stuff going on both in my life and in my mind, but I’m determined to finish this thing. Previous posts:

Part 1
Part 2

This is the section in which everything that was talked about before is kind of recapped and explained and, well, justified. I approached this in a much simpler format, because that’s really all it needs. My comments are bolded.

DISCUSSION

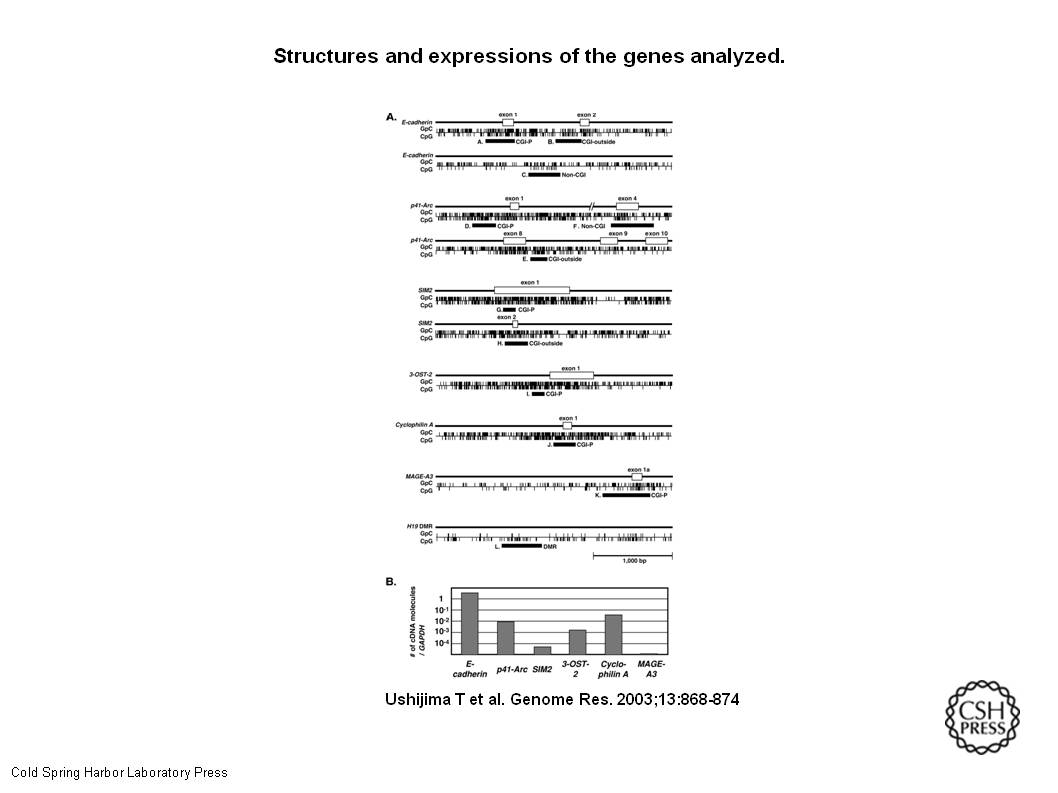
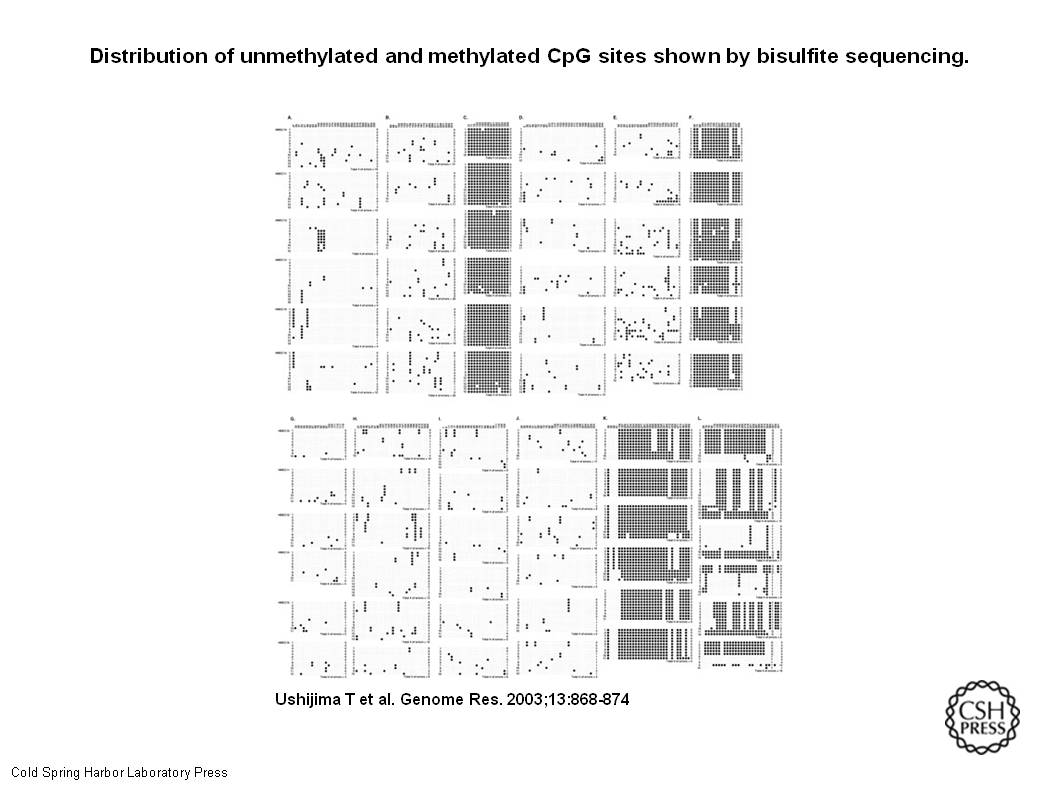
It was first demonstrated here that the fidelity of replicating methylation patterns of CGIs in the promoter regions is significantly higher than that of CGIs outside the promoter regions. (CGIs in promoter regions replicate themselves more accurately than the ones outside of promoter regions.) It was also demonstrated here that methylated genomic regions show much higher fidelity than unmethylated genomic regions. (If the genes are methylated, they tend to stay methylated, if they’re unmethylated, they can become methylated.) These showed that maintenance methylation of hemimethylated CpG sites into fully methylated CpG sites at DNA replication was highly reliable, while unmethylated CpG sites tended to be methylated by de novo methylation. (Methylation sticks.) It is well-known that exogenous DNA is exposed to a de novo methylation pressure (Doerfler et al. 2001; Bird 2002), and a similar methylation pressure seems to be working on the endogenous DNA. (Unmethylated sites are vulnerable to methylation from outside sources.) To maintain the unmethylated status of CGIs, protection mechanisms from the de novo methylation pressure seem to be necessary. (Unmethylated CGIs need something that protects them from methlyation or they’re vulnerable to it.) Since the MPERs were significantly lower in CGIs in the promoter regions than in CGIs outside the promoter regions, the presence of a protection mechanism(s) specific to the promoter regions, in addition to a mechanism(s) common to all CGIs, was indicated. (Promoter region CGIs probably have stronger protection against methylation of unmethylated regions, because they resist methylation better than non-promoter-region CGIs do.) Although the details of the mechanisms are still unknown, binding of transcriptional factors, such as Sp1, has been indicated as a promoter-specific mechanism (Han et al. 2001). (Hint, hint – this is something someone might want to look into, guys, ‘cuz our grant has been spent! Heh.)

The differential fidelities in replicating methylation patterns of CGIs in the promoter regions and those outside indicated that aberrant methylation of CGIs would occur at different rates depending upon their locations. This will be important when tumors are analyzed for the CGI methylator phenotype (CIMP), which are considered to be caused by molecular defects that allow accumulation of aberrant CGI methylations (Toyota et al. 1999). The differential fidelities shown here suggest that there are two types of CIMP, one due to a defect(s) in the protection mechanisms common to all CGIs and the other due to a defect(s) in the protection mechanisms specific to CGIs in the promoter regions. Actually, a correlation between the CIMP and the diffuse-type histology was clearly observed in gastric cancers when CGIs in the promoter regions were used for CIMP analysis (Kaneda et al. 2002b), while it was unclear when CGIs outside the promoter regions were used. (This will help us do more research that will help with cancer prediction/prevention/treatment, in case you don’t think that these findings have a worthwhile purpose of their own. When in doubt, reference cancer. For people with maybe a little less vision or curiosity. Just sayin’.)

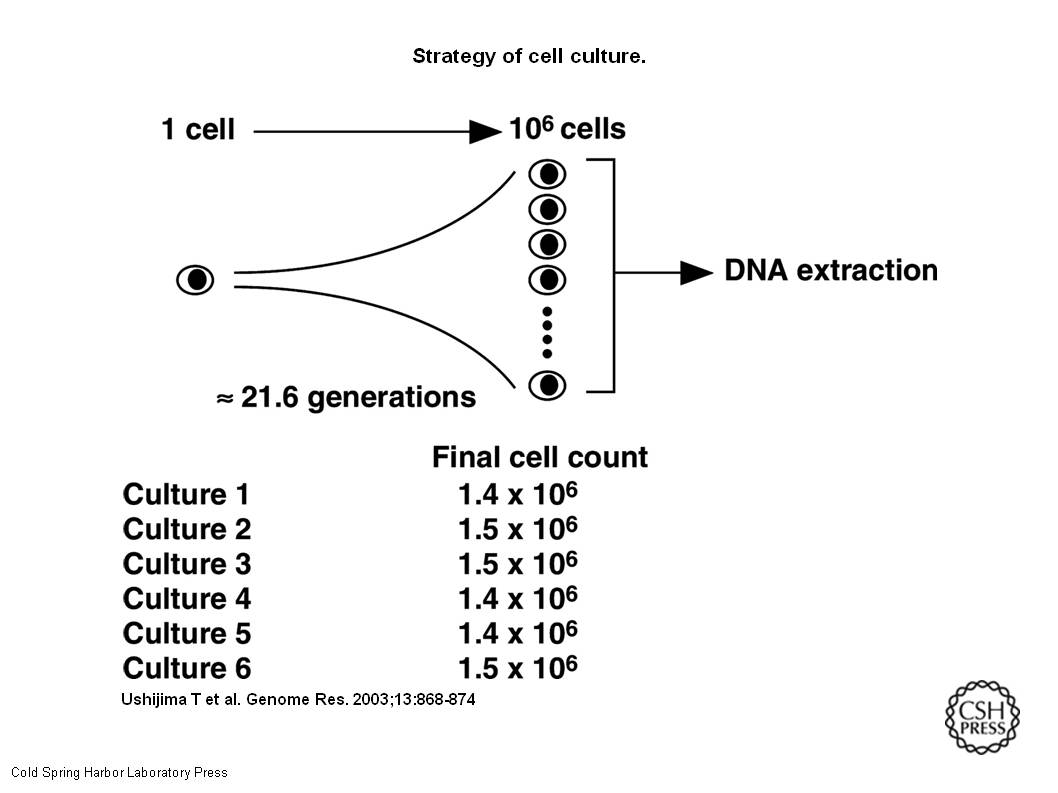
In order for an impaired fidelity in maintaining a methylation pattern to exert any biological effect, methylation statuses of multiple CpG sites in a CGI must be altered. (One change at a single location isn’t going to make a big difference.) A significant increase of MPERs would be necessary for this, and quantitative analysis of MPERs in cells with suspected increase of MPERs is necessary. (We don’t know how many besides “more than one,” so another study would be required.) DMR of the H19 gene had a polymorphism at nt. 391 (nt. 8217; GenBank accession no.AF125183), and this served to distinguish the two alleles clearly. (This location was where we could best see what happened.) The G-allele was methylated in all of the six cultures, and the T-allele was unmethylated. The methylation patterns of the T-alleles were similar in HMEC11 and HMEC15, but were essentially variable among the six cultures. This indicated that, although the original cells in HMEC11 and HMEC15 might have had a common ancestral cell, methylation patterns in a tissue alter significantly during a human life span. (Methylation may change because of time, not necessarily because something came in and methylated stuff. No pointing at a specific environmental influence like a chemical or somesuch. Just demonstrating that it happened, and where and why it would be more or less likely to happen.)

Future clarification of what protection mechanisms are involved and how they are impaired in various diseases will contribute to understanding of aging (Ahuja et al. 1998; Issa et al. 2001) and various pathological conditions. (This is a single step in a huge process, but it puts us on a track to learning more than what we know now.)

Learning from Research, The Results.

Learning from Research, The Results.

This is the part where my brain is going to explode. I might need to break this up into more than one post.

RESULTS
Preparation of HMECs

A single HMEC in its log phase was plated, and expanded to 1.4 × 106 to 1.5 × 106 cells (Fig.1). Plating efficiency during the two transfers of plates was 67 ± 0.9(mean ± SE)%. Based on these values, the number of cells that should have been produced at the time of harvest was calculated as 3.2 × 106(1.4 × 106/0.67/0.67). This value predicted that each cell harvested underwent 21.6 generations from the initial single cell. Doubling time was 48 h.

Strategy of cell culture. A single HMEC was inoculated in a well by limiting dilution, and the cell was expanded up to approximately 106 cells. Based on the plating efficiencies during the two transfers and the actual final cell count, the number of cells that should have been produced at the time of harvest and the number of generations observed were calculated. DNA was extracted from the final cells, and used for bisulfite sequencing. Six independent cultures were performed.
Slide1

HMEC – Human Mammary Epithelial Cells. They were put into a container, allowed to reproduce, and then they were checked to see if the right number of cells were made after specific numbers of generations. There were six containers of these cells. Once enough generations had passed and there were enough cells, their DNA was tested with the bisulfate test (illustrated in my earlier post.)

Gene Selection and Their Expression Levels

Methylation statuses were determined by bisulfite sequencing for CGIs in the promoter regions of the E-cadherin,p41-Arc, SIM2, 3-OST-2, and Cyclophilin A genes; CGIs in the downstream exon/introns of theE-cadherin, p41-Arc, and SIM2 genes; CpG sites outside CGIs of the E-cadherin and p41-Arcgenes; a NM-CGI of the MAGE-A3 gene; and differentially methylated region (DMR) of the H19 gene (Fig.2A). The former five genes were selected because they had CGIs in the downstream exon/introns that met a strict criterion of CGIs, regions of DNA of >500 bp with a G+C ⋝ 55%, and observed CpG/expected CpG of 0.65 (Takai and Jones 2002). The MAGE-A3 gene and the DMR of the H19 gene were selected as a representative NM-CGI and a region critically involved in genomic imprinting, respectively. By quantitative RT-PCR analysis, their expression levels were shown to range from almost none (SIM2 and MAGE-A3) to very high (E-cadherin), with p41-Arc, 3-OST-2 andCyclophilin A being intermediate (Fig. 2B).

Structures and expressions of the genes analyzed. (A) Schematic representation of the genomic regions analyzed. Regions analyzed by bisulfite sequencing are shown by closed boxes, and designations A–L correspond to panels in Fig. 3. CGI-P: a CGI in the promoter regions; CGI-outside: a CGI outside the promoter regions; Non-CGI: CpG sites outside CGIs; and DMR: differentially methylated region. All panels are drawn to the same scale. (B) Expression levels of the seven genes in HMECs.
Genome Res. 2003 May 13(5) 868-74, Figure 2

Sorry, I can’t even. All I know from this is that they looked at the results of the bisulfite sequencing and found what they were looking for – the methylation status in the CpG Islands from promoter regions of DNA stayed almost exactly the same. Unmethylated CGIs from non-promoter regions were more likely to become methylated. I’m afraid I don’t have the ability to explain this to you or tell how accurate or flawed it may be. I’m taking the researchers’ word on it. Correct me if I’m wrong.

Establishment of How to Measure MPERs

The CGI in the promoter region of the E-cadherin gene (Fig.3A), the non-CGI region of thep41-Arc gene (Fig. 3F), the CGI in the promoter region of theMAGE-A3 gene (Fig. 3K), and the DMR of the H19 gene (Fig. 3L) were found to contain two major populations of clones. The two major populations were considered to represent the methylation pattern of the two alleles in the original single cell. The methylation patterns of the two major populations were different from each other in the six cultures, which indicated that the HMECs before cloning had diverse patterns of methylation, but the patterns were relatively conserved during the culture from a single cell to approximately 106 cells. Therefore, we measured the number of errors in the methylation pattern based upon the culture from a single cell to approximately 106 cells. An MPER of a region in a culture was calculated from the number of errors in methylation pattern as described in Methods, and an average MPER of the region was calculated from the six MPERs obtained for the six cultures.

MPERS – Mammalian Protein Extraction Reagent
AlleleAn allele is one of two or more versions of a gene. An individual inherits two alleles for each gene, one from each parent. If the two alleles are the same, the individual is homozygous for that gene. If the alleles are different, the individual is heterozygous. Though the term “allele” was originally used to describe variation among genes, it now also refers to variation among non-coding DNA sequences.

So after making all those cells, they looked to see where and whether methylation status had changed.

Distribution of unmethylated and methylated CpG sites shown by bisulfite sequencing. Unmethylated and methylated CpG sites are shown by open and closed circles, respectively. (A)–(C) A CGI in the promoter region, a CGI outside the promoter region and CpG sites in non-CGIs of the E-cadherin gene. (D)-(F) A CGI in the promoter region, a CGI outside the promoter region and CpG sites in non-CGIs of the p41-Arcgene. (G), (H) A CGI in the promoter region and a CGI outside the promoter region of the SIM2 gene. (I) A CGI in the promoter region of the 3-OST-2 gene. (J) A CGI in the promoter region of the Cyclophilin A gene. (K) A CGI in the promoter region of the MAGE-A3 gene, which is normally methylated. (L) A CGI in the differentially methylated region of the H19 gene.

Here’s where they found the differences:

Genome Res. 2003 May 13(5) 868-74, Figure 3

To examine the effect of an arbitrary selection of the “original methylation pattern” in ambiguous cases, a permutation test was performed for the CGI in the E-cadherin promoter region of HMEC10. One of the clones #5–#14 (Fig. 3A) was hypothesized as one of the original methylation pattern, and the number of errors in the methylation pattern was calculated. The numbers ranged from 18–22, and these values were expected to result in the average MPER ranging from 0.022–0.023. Similar permutation tests were performed for the CGI in exon 2 of the E-cadherin gene of HMEC12 and HMEC15. The numbers of errors in methylation pattern ranged from 13–16 for HMEC12 and from 12–15 for HMEC15, and these values were expected to result in the average MPER ranging from 0.050–0.058. These showed that arbitrary selection of the original methylation pattern in ambiguous cases does not seriously affect the resultant average MPER.

Some changes weren’t so cut and dried, so they checked those cases and found that they weren’t significant enough to change the findings.

The efficiency of bisulfite conversion was examined by analyzing DNA with no methylation in the CGIs in the promoter region and exon 2 of the E-cadherin gene. In the CGI in the promoter region, none of the 600 cytosines at CpG sites (30 CpG sites per clone, 20 clones analyzed) remained unconverted, showing that unconversion rate was almost 0 in this region under our experimental condition. In the CGI in exon 2, one of 483 cytosines at CpG sites (23 CpG sites per clone, 21 clones analyzed) remained unconverted, showing that the unconversion rate was 0.0021. These values showed that the MPERs in CGIs in the promoter regions are 10-fold more than the unconversion rates.

The bisulfate conversion was also tested separately for control to make sure the results would be valid in the experiment. This reinforced the finding that the promoter regions stayed stable.

MPERs and Fidelities of Methylation Pattern in the Genome

The average MPERs obtained for each region are summarized in Table1. Unmethylated CGIs in the promoter regions showed MPERs between 0.018 and 0.032 errors/site/21.6 generations. In contrast, CGIs outside promoter regions showed significantly higher MPERs, ranging from 0.037 to 0.091 (P < 0.01 or 0.005). MPERs in the CGIs outside the promoter regions were more than twice as high as those in the promoter regions of the same genes. MPERs in Various Genomic Regions

NM-CGI of the MAGE-A3 gene and methylated alleles of the DMR of the H19 gene showed MPERs of 0.002 and 0.007, respectively. Any genomic regions that were normally methylated, whether or not they were in CGIs, showed significantly lower MPERs than those unmethylated. This was particularly clear when the MPER of the allele methylated at DMR of the H19 gene was compared with that of the other unmethylated allele.

Interpretation of the tables, summary of findings.

This is not as good as part one, sorry. In other news, I couldn’t watch Besharam because it sucked, so I didn’t learn any Hindi, either. One more post to go in this series. Anyone who can clarify/explain better than I can, please comment – I’d appreciate it.

Science Education – How I Would Do It.

Science Education – How I Would Do It.


Of course, this is assuming that the world was a sensible place and I was in charge of all the important decision-making. Heh.

Over time, I’ve come to realize that a lot of the things I was taught in school didn’t stick because they weren’t interesting. They weren’t interesting because they were unrelated to my life, and I couldn’t see how they could possibly be important to me. I memorized things for tests, and I did a darn good job of it, good grades, good standardized test scores, but only because I had to, not because I wanted to.

As I got older some of it came back – and it stuck better because I had context to put it in. Before kids and before antidepressants, I read a lot of romance novels for escape (I know. . .I’m not proud, but I had an excuse.) Soon I discovered that there was a sub-genre of Historical Fiction – and some of these authors were real history buffs who included a lot of factual information. In the context of a story, with characters and plots that engaged me, I was finally learning something about history, which had bored me to tears in High School.

Later, I started reading some of the books and papers that had been assigned back then. . .suddenly they were interesting and made sense – because I now had a context for them. The context continued to expand, and more information became part of what I knew.

_______________

For me, possibly moreso than for many people, context is essential. My ADHD mental filing system demands context and associations not only for learning, but for retrieving that learning. So when I teach people what I know, I teach it in context. I learn a lot by making mistakes, so I teach “do it this way because this other way doesn’t work,” and “we do it this way because otherwise we break this piece and the whole thing is ruined.” I teach “This part seems boring, but here are all the cool things we can do with it later.”

I also learned a lot from raising my own kids and volunteering in their schools, helping all kinds of other kids learn. You need to be able to express a single piece of information many different ways in order to get different kids to understand it. As a volunteer, I was able to sit with individual children and small groups. The kids who didn’t understand things when they were taught the same way to all 30-something students would get it if I spent some time with them and figured out what their individual contexts were.

_______________

Fast forward to the mid 90s – I started antidepressants, and then I discovered that my ADHD had not actually gone away as the experts had told my parents it would, and as my parents told me it had. Now I had a reason to learn about the brain, starting with disorders and injuries, and what they taught us about the functions of various structures. That gave me a context to learn about brain development and genetics. This led to investigating epigenetics. Along the way, it also tied in to reading medical and science blogs and books, and any time a piece of knowledge stuck to something that was relevant to something I already knew, it also became relevant.

So why do you want to listen to someone who doesn’t have a degree in science or medicine when it comes to science or medicine? Because of the way I’m learning it. That whole “Translating Science into English” thing I mentioned a few posts back. Scientists have their own language, and it’s important that they do so they speak with clarity and precision. But if you don’t have the context that they do, it’s hard to understand – and easy to misinterpret. I didn’t learn this in the linear fashion that they did.

If you were to teach me vocabulary and facts and mechanisms, I’d remember it just as well as I did in high school. But give me a study of something that relates to something that interests me, and I will look up all those words and facts and mechanisms, and they’ll make sense because they’re part of something else. They have more meaning when they’re in context.

The other thing I learned came from watching scientists argue with one another. While they’re not always polite, they always present evidence. Most of them are critical thinkers, when someone says something that is questionable, they will (sometimes very methodically and in great detail) explain the flaws in the reasoning. Following along with this taught me the scientific method and why it’s important, how to evaluate how robust the data is by looking at the size of the study, the quality of the blinding, the strength of the variables and controls, how well it integrates existing evidence (and how strong that evidence is) and, most importantly, no matter how good a study may be, it’s never PROOF. It also doesn’t prove other things that weren’t part of the study. It’s also probably not a major breakthrough.

I learned about p-values, journal impact factors, the good and bad of peer review, the pros and cons of open access. I learned that not all “evidence” is actually evidence.

_______________

The problem that many, many scientists have, though, is that they forget what it’s like to not know this. Sometimes they present what they know in a way that is off-putting to laypeople. Sometimes they present a press-release version of their findings, breathless with excitement and full of hyperbole, and that’s even worse. (That’s what we have The Daily Mail and Huffington Post for. Let them do their job.)

So if I were a science teacher, or I were designing a science education program, I’d throw out teaching the basics as freestanding facts. Get rid of the rote learning. Give the students just enough information to dive into a challenge and figure out the rest. Give the kindergarteners a bowl of cream and some food coloring and dish soap – let them play and then tell them how it works. Let the older kids listen to each others’ heartbeats, check each others’ blood pressure, draw pictures of hearts and veins and arteries, and use that to introduce the circulatory system. Make everything part of an experiment that related directly to them so that it was important. Let them figure out what’s correct and what’s incorrect as much as you can on their own by giving them questions as much as answers. Make the science interesting and integrate critical thinking into the lessons, and get them excited. This will be good for them, and good for society, because they’ll question everything – and come up with their answers based on what evidence is best supported.